
When a business starts collecting Internet of Things (IoT) data, the expectation is instant clarity. The reality is usually a firehose of raw, noisy data.
Recently, a client approached us with a massive dataset spanning months of IoT readings from sensors attached to brine tank lids. The goal was simple: track salt usage and alert the team when a tank needed a refill or maintenance. The problem? The data was full of anomalies caused by salt bridges, defective hardware, and dusty sensor glass.
The client had explored using heavy AI tools or standing up third-party platforms like Grafana. Instead, we delivered a lightweight, custom data visualization and alerting system that cut through the noise without inflating their budget.
Here is how we turned messy IoT data into actionable business intelligence.
The Challenge: Finding the Signal in the Noise
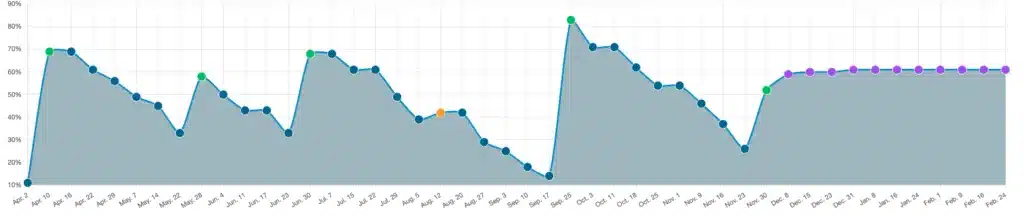
In the image above, you'll notice clear refill events, when the level increases to 70% or more. You'll also notice some anomalies, where the level increases by anywhere from just a few percentage points to maybe 15%.
Tanks are supposed to slowly empty, then suddenly fill. However, the data we received was all over the place. We needed to identify patterns that indicated unusual salt levels spanning days, weeks, and months.
To solve this, the system needed to automatically detect specific anomaly states:
-
Normal Usage: Steady depletion over time.
-
Refills: Sharp increases indicating a successful service visit.
-
Stalls: Periods where the data flatlines for over 60 days, often indicating a salt bridge or a blocked sensor.
-
Suspicious Drift: Small, incremental increases in salt levels that shouldn't physically happen.
The Strategy: Pragmatism Over AI Hype
It is tempting to throw Artificial Intelligence at every data problem, but AI is often overkill for geometric pattern recognition.
Rather than billing the client for an over-engineered, expensive AI solution, we utilized a deterministic, math-based approach. We chunked the massive data sets into manageable "cycles" (separated by refill events) and applied standard Linear Regression to calculate the daily rate of change.
This straightforward mathematical approach allowed us to set strict business-logic thresholds. If a cycle's slope was too flat for too long, it was flagged. If the data drifted upward by a few percentage points without triggering a refill threshold, it was flagged.
The Execution: Constraint-Driven Engineering
Every great tech consulting project respects the client's constraints. In this case, the client was not yet ready to modify their existing database schema to store pre-calculated anomaly data.
To respect this boundary while still delivering a robust solution, we engineered the logic to calculate on the fly:
-
Real-Time Visualization (PHP & Chart.js): We integrated directly into their existing PHP web portal, analyzing the MySQL data on page load to generate highly visual, color-coded graphs.
-
Automated Alerts (Node.js): We replicated the core calculation engine in a standalone Node.js script. This acts as a background module that can scan all sensors nightly and fire off alerts if a tank goes rogue, removing the need for a human to manually review charts.
This dual-language architecture served as a rapid prototype to quickly validate the math, setting a perfect foundation for a centralized API once the client is ready to expand their database.
The Result: Clear Visuals, Fewer Wasted Resources
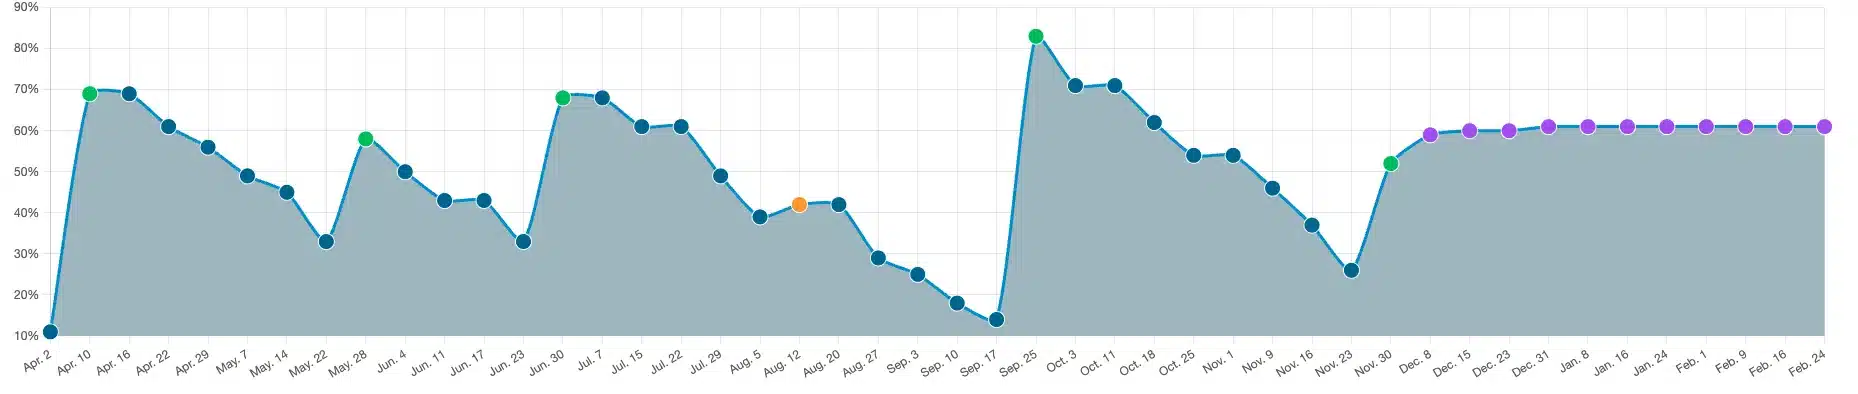
By color-coding the data points (Refills, Stalls, Suspicious Drifts), we took raw, messy IoT data and turned it into an immediate, visual dashboard.
The business impact is direct and measurable:
-
Reduced Cognitive Load: Operators no longer have to guess what a line chart means; the system highlights problems automatically.
-
Preventative Maintenance: Identifying "Suspicious Drifts" early prevents total sensor failure.
-
Fewer False Truck Rolls: Knowing the difference between a normal reading and a blocked sensor saves time and fuel.
You don't always need an expensive AI platform to tame your data; sometimes, you just need smart math, clean code, and a consultant who listens to your business needs. We still used AI assistance to iterate through the code and formula, which actually reduces cost of development upfront, instead of increasing cost over time for token consumption. This leaves us with lower development costs and fewer AI anomalies, overall creating a safer and more effective solution to a simple problem.